22 July 2022
How to integrate Safetica ONE with Power BI?
Table of Contents:
- Introduction
- Automatic Database Integration
- Manual Database Integration
- Example Report Templates
- Activity Dashboard
- Data Security Dashboard
Introduction
Learn how to use your DLP log data to increase your reporting capabilities by following the guide below. Safetica ONE can use its analytical interface to integrate with other data analysis tools such as Power BI or Tableau. This solution will allow you to create more precise, flexible and tailored reports.
Administrators can link their database in Safetica to analytic tools. Suppose they also have other data sources connected to the tool (e.g. the company's HR system). In that case, they can group information from logs into any organisational structure tailored to their needs or create a comprehensive management dashboard, answering key user questions based on data from Safetica and other sources.
To make integration even more manageable, Safetica has made 2 predefined report templates available to its customers - the Activity Dashboard focusing on user actions and the Data Security Dashboard.
How do I integrate Safetica with my data analysis tool?
Integration can be done automatically or manually, depending on the privileges of the database account.
Automatic Database Integration
If your SQL server has been installed and configured by Safetica, you can integrate the database automatically with Safetica Management Console. Simply enable "data analysis integration" and sign in to the data analysis tool with your new database account and password. If the switch is unavailable and grey, request the appropriate permissions or perform manual database integration (see instructions below).
- Go to Safetica Management Console > Profile > Server Settings
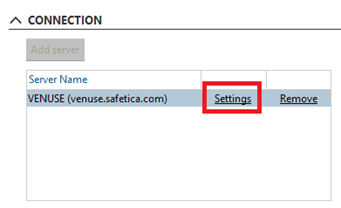
- In the section Data Analytics, switch Data Analytics Integration to Enable

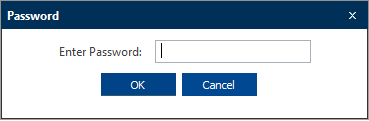
- You will then be asked to create a password for the new database account
- Click Exit at the bottom of the screen - A script creates a database schema, database views, and an account through which you can access the data. The database account will use the following credentials:
- Username: safetica_da
- Password: the one you created in step 3
- The new account has read-only permissions and only has access to the created database schema.
- Once the script is finished and you have created a database account, you can open the data analysis tool and add a new data source. After completing the credentials (step 4), the database is connected, the data is loaded, and you can start creating the report. You can use one of our report templates or create your data visualisation.
You can download our template here: Activity Dashboard
You can download our sample here: Data Security Dashboard
You can see the information you need here: create your visualizations
Manual Database Integration
If you have installed your database and are using your permissions, you must run the script and enable integration manually.
Open the command line and run the following commands with the appropriate permissions:
- EXEC [pbi].[create_da_user] @password = N'your_password'
- EXEC [pbi].[enable_pbi]
Password strength must match the SQL Server configuration.
When the script is finished, see step 5 in the section Automatic Database Integration.
If you want to delete your account:
- Open a command line and run the following command with the appropriate permissions: EXEC [pbi].[delete_da_user]
Example Report Templates
Safetica provides two report templates - activity panel and data security panel. Just connect them to your database and fill in the data from the DLP logs. See examples of connecting these dashboards to the Safetica database in Power BI:
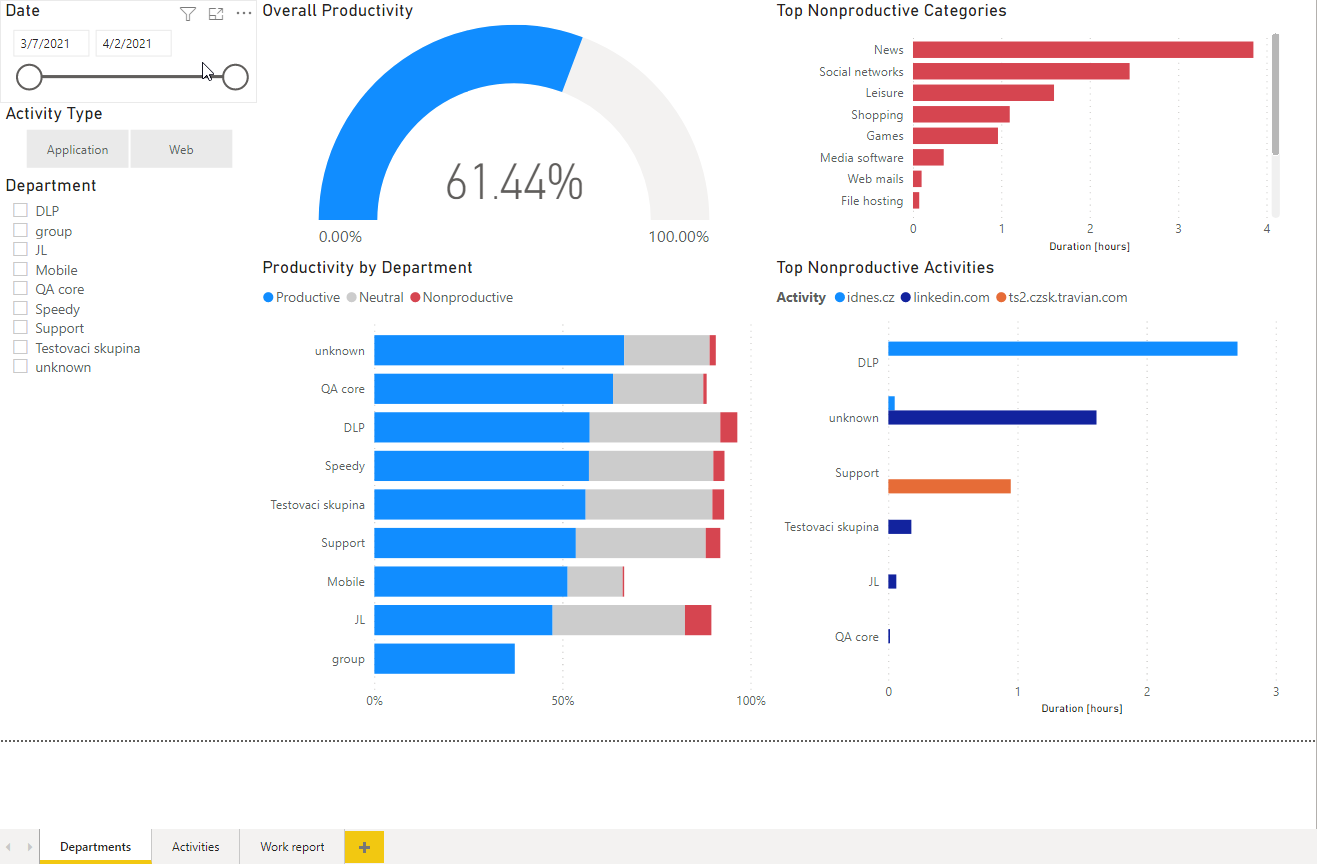
Activity Dashboard
This template focuses on user activity and remote work. It can be filtered by time range, activity type, or department. The activity panel is divided into 3 sections:
- Departments - you can see the overall productivity of all users or individual departments of the company.
- Actions - The section focuses on specific applications and websites and identifies those that may cause problems in the protected zone. You can see the most common productive and non-productive activities.
- Work Report - can be used to control remote work time. You can see how long individual users have been logged in on their computers and how long they have been actively using them.
Example of an activity dashboard in Power BI:
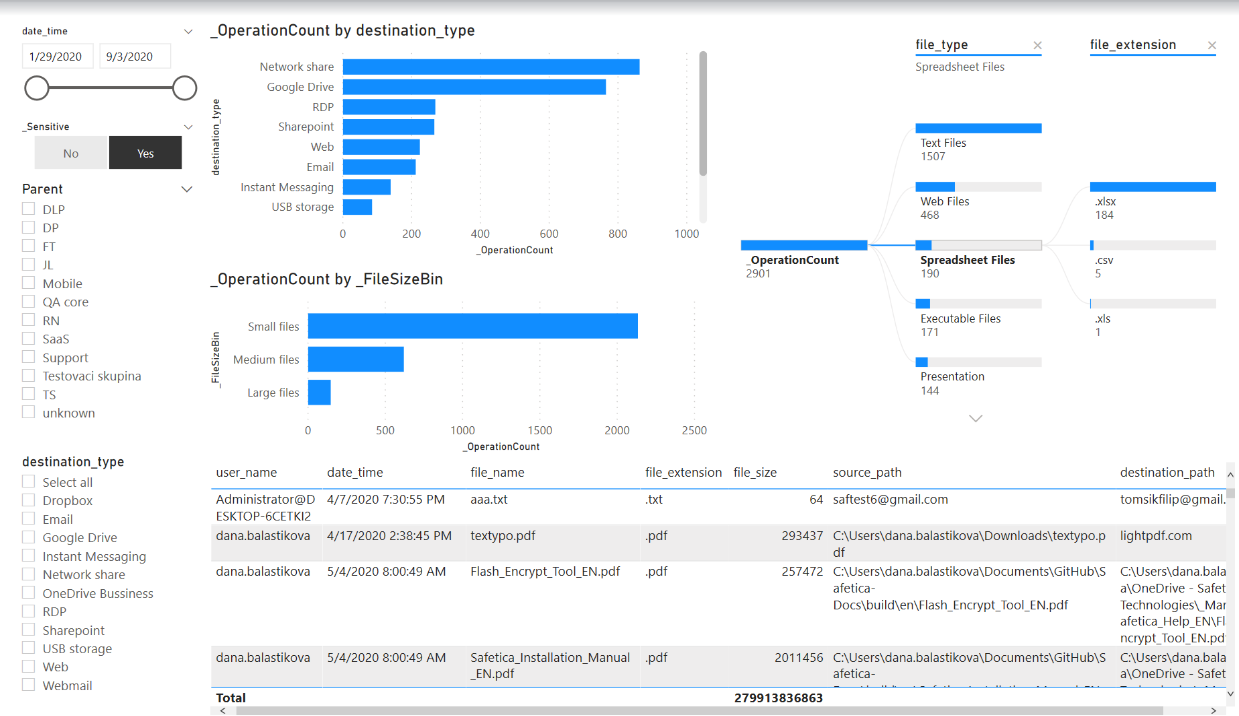
Data Security Dashboard
This template is based on file operation logs, including only outgoing files. The data security panel is divided into 3 sections:
- Dataflow - you can see which files and where they leave the environment (RDP, Web, E-mail, IM, USB, etc.), as well as their sizes. You can filter the time range, individual channels and file types. You can also switch between viewing all files or viewing only sensitive files (i.e. files that have an assigned data category).
- Network shares - an overview of the types of files that can be found in individual network shares. This section can also be filtered by time range, file type, and sensitivity.
- Risky operations - in this section you can see operations marked as risky by Safetica. You can only filter out sensitive files or specific users for a detailed overview of what happens to sensitive data in your company. Risky operations are highlighted and you can see how many have been performed
Example data security dashboard in Power BI:

Mateusz Piątek
product manager Safetica
Do you have any questions?
Contact me:
piatek.m@dagma.pl
532 570 255
Similar content: